Mapping heat stress with Google Earth Engine
While climate prediction data is readily available, a significant challenge in the Global South lies in effectively harnessing this data and understanding how it can be applied to context-specific planning.
About the training
The impacts of climate change are becoming increasingly visible and are falling disproportionately upon countries with weaker capacities to adapt. Supporting students and researchers to explore and understand these impacts will contribute to capacity building in contextual adaptation planning.
One of the impacts of climate change is heat stress. The increased frequency of heat stress induced by climate change is more likely to disproportionately affect developing countries, particularly households in poverty and those marginalised in terms of access to energy. Empowering local communities to assess the risks associated with heat stress and utilising this information for improved energy service planning is crucial for adaptation and overall well-being.
Program aims
This program will offer participants:
- Insightful discussions on the intersection of heat stress and energy services.
- Training for interested students on utilising Google Earth Engine to map the probability of experiencing heat stress and its impact on energy services.
- Opportunities for students to work with their chosen datasets and share their findings, enhancing their skills in communicating climate change-related information.
- Widespread access to valuable knowledge and learning resources via open-access information
Why participate?
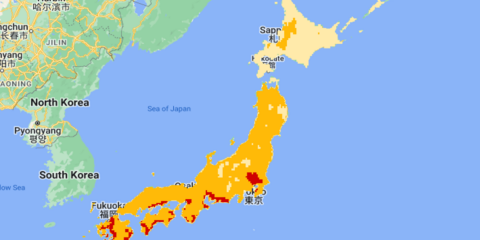
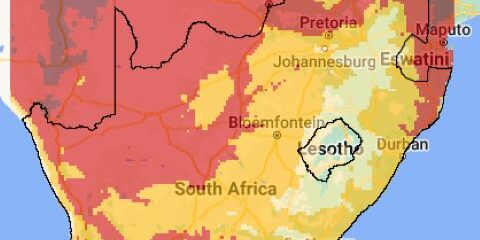
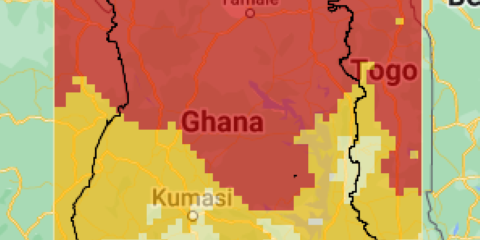
To allow participants to work with climate model data and create their own heat stress maps. The participant will learn how to interpret visualisations of heat stress maps and use them as a tool to communicate the impact of heat stress and its spatial distribution. Participants will also be able to use the maps to inform possible energy demand in response to heat stress and tell their stories to local governments.
Learning outcomes
After completing the program, participants will be able to discuss climate data and describe the use of Google Earth Engine. Participant will be able to download the data and map the heat stress in different scenario and explain it to their friends and community.
Use the tabs below to find the information required to participate in this course.
The program will run for three weeks. The first week will be a single two-hour general session with a keynote talk from an expert to provide the context and importance of heat stress mapping to understand future energy service requirements. The following two weeks will have technical sessions aimed at practitioners. There will be two two-hour sessions per week. In the final session, participants will present their map and briefly discuss their interpretations of it.
Dates and times
13-14 February 2024 (Week 1)
20-21 February 2024 (Week 2)
27-28 February 2024 (Week 3)
20:00hrs NZDT (New Zealand), 12:45 NPT (Nepal), 08:00 WAT (Nigeria)
The training program will encompass core concepts related to climate change data and the mapping of temperature data to locate the areas likely to suffer from the heat stress. It is designed to equip participants with fundamental skills for accessing climate data, utilising Google Earth Engine to create maps, and processing this data to analyse the spatial distribution of heat stress and ultimately inform changing energy needs.
To cater to individual interests, the program will feature 3 to 5 modules, allowing participants to select the modules that align with their preferences. Our informal working group will determine the specific set of modules. The learning approach involves a combination of instruction and hands-on practice.
Recognising that everyone progresses at their own pace, we have established separate breakout rooms to provide additional support. This ensures that all participants can successfully complete the course and achieve their personal learning objectives.

Session 0: Pre-training session
OBJECTIVE: Introduction to Google Earth Engine
Sign up for Google Earth Engine
Download data and receive a brief introduction to the platform
Session 1: Introduction and keynote (13 Feb)
OBJECTIVE: Understand the course, processes and expectations
Part 1: Why and how of the training and session
5 slides about objective team, process and expectation (10 minute)
Part 2: Keynote and Q&A
Keynote: Climate change and future energy demands (1.15 hour)
Q&A with expert (25 min)
Summary and thank you (10 minute)
Session 2: Technical session (14 Feb)
OBJECTIVE: Build familiarity with data, heat stress maps, input/output and open access data sources
Part 1: Understand data
Discuss data and its descriptive statistics
Build familiarity with data
Part 2: Introduction to risk mapping
Read and interpret risk maps
Part 3: Basics of risk models
Learn how modelling is done
Part 4: Data sources
Learn about open-access data
Session 3: Practical session (20 Feb)
OBJECTIVE: Experiment with the GEE using temperature data
Part 1: Upload data and understand GEE
Use temperature data at your university
Part 2: Identify key issues for your university and resolve
Identify key problem or issues in uploading data and resolve
Session 4: Practical session (21 Feb)
OBJECTIVE: Learn to map
Part 1: Map your chosen data
Use open-source climate data for heat stress mapping
Part 2: Experiment with maps
Identify hotspots and impact
Session 5: Application (27 Feb)
OBJECTIVE: Understand map applications
How can data be used?
Impact of heat stress over spaces
Session 6: Communication (28 Feb)
OBJECTIVE: Communicate climate data and its importance to the community
Presentations
Present the maps and respond to questions
Training resources are available on the CIET GitHub.
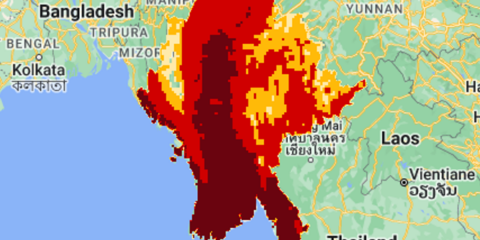
Myanmar
by Mungunshagai Gansukh
Mongolian University of Science Technology (MUST), Mongolia
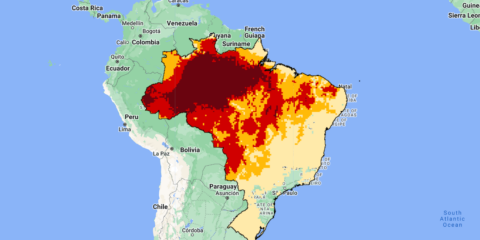
Brazil
by Farah Naz
Pakistan Institute for Development Economics (PIDE), Pakistan
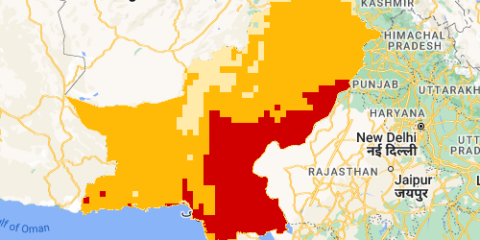
Pakistan
by Mohammad Armughan
Pakistan Institute for Development Economics (PIDE), Pakistan
Technical resource leaders

Darcy Glenn (Technical Lead)
University of Canterbury, New Zealand
Darcy Glenn has worked to bring climate science to local governments so they can make informed decisions. She was a research assistant on Woodwell Climate Research Center’s Risk team, working on free climate risk assessments for local governments.

Dr Bishal Bharadwaj
Curtin University, Australia
Bishal Bharadwaj is a quantitative economic geographer interested in evaluating environmental policies (energy, plastic, pollution and climate change) in heterogeneous contexts to identify strategies to ensure policies are effective and equitable. He is currently a Research Fellow at the CIET.

Dipendra Bhattarai
International Centre for Integrated Mountain Development
Dipendra Bhattarai brings a decade of experience collaborating with grassroots organisations and leveraging remote sensing skills to address the challenges of sustainable development goals in data-scarce regions. His research focuses on artificial night-time lights, energy, and climate policy, utilising data to translate complex information into actionable insights through a blend of economic and spatial rigor.
Dr. Monjit Borthakur
Cotton University, India
Monjit is an Assistant Professor in the Department of Geography at Cotton University. His research interests include ecology and the environment, remote sensing and geographic information systems (GIS).
Janice Mwasi
University of Strathmore, Kenya
Janice is part of the Department of Mathematical Sciences at Strathmore University. Her research interests include financial analysis and business finance.
Contact details
If you are registered for this training and need assistance, contact the training coordinator as below.